
Several geophysical techniques have been used to map the ground beneath the Cornell campus, including aero-magnetics, gravity methods, and active and passive seismic reflection surveys. In addition to creating detailed maps of the subsurface in three dimensions, the surveys are being used to identify any pre-existing planes of weakness that may potentially be reactivated as a result of ESH operations.
Using several methods allows us to overcome the inherently high cost of some of the most precise geophysical imaging methods. We need to understand the subsurface of an area much broader than the Cornell campus, yet the accuracy and spatial resolution must be greatest for the Cornell campus. The aero-magnetic data cover all of Tompkins County; the gravity survey is centered around Cornell’s campus and surrounding areas. A commercially acquired set of active seismic reflection data for much of central and eastern Tompkins County were leased and analyzed; active seismic reflection data were acquired by Cornell faculty and students on the eastern end of Cornell’s campus. A newly installed passive seismic monitoring array covers much of central and northern Tompkins County.
The principle underlying the use of aeromagnetic and gravity data to detect major subsurface features is that lateral contrasts in rock density or magnetic mineral content, respectively, may exist and will be revealed by mapping the spatial pattern of variability of the Earth’s gravity field and magnetic field. These methods are especially sensitive to features in the metamorphic rock basement, yet in principle they may also identify certain types of major features in sedimentary rock. For a case like Ithaca, with a thick cover of sedimentary rocks overlying the basement, mapping with those methods provides relatively low spatial resolution images of the subsurface.
Passive monitoring of seismic waves identifies zones of shifting rocks. National and regional seismometer networks demonstrated that Tompkins County has no more than a low level of natural seismic activity, yet those pre-existing regional networks are not sufficiently sensitive to reveal all that is of interest to a risk analysis. The position of a zone that generates natural seismic activity would be well identified if the recording instrument network surrounds the zone(s) and is sufficiently sensitive, but the location is rather imprecisely known if the zone of seismic activity lies outside of the instrument network. Consequently, multiple stages of deployment of seismometers have been needed, to first learn roughly where there might be zones of interest in Tompkins County, and then to better document the locations and depths of such features with data collected later by better located seismometers.
Reflection seismic profiles image interfaces between rocks of different sound wave transmission properties. Reflection profiles are especially effective in the layered sedimentary rocks, where the plausible explanations for reflections or discontinuities are straightforward, but the interpretation of features in metamorphic basement rocks is much less certain.
Gravity Survey
Lateral discontinuities in mass density of the subsurface are registered at the surface as anomalies in gravity. We conducted a gravity survey over a roughly square grid measuring 10km by 10km. Gravity was measured at almost 400 stations using a Scintrex CG5 gravimeter, with a median precision of 23 micro gals. The data was analyzed using a potential field Poisson wavelet analysis (“Worms”) to detect multiscale edges (Horowitz et al., 2018). The physical interpretation of the Worm technique identifies the location of discontinuity at a suite of depths, with the assumption that “rocks have edges”. Gravity worms identified several dipping structures both close to the surface and at depth.
Horowitz (2020) reports the features below the surface that were illuminated by magnetic field and gravity field methods (https://hdl.handle.net/1813/69612).
Vibroseis Seismic Reflection Surveys
When a sound (seismic) wave traveling through the subsurface encounters a change in rock density or seismic velocity, often at the interface of two rock layers, it reflects back to the surface where it is recorded by a receiver. The data collected by the seismometer receivers during the active survey can be processed in order to generate seismic profiles of the subsurface which can be used to identify structures in the rock layers. These profiles often show the two-way travel time of an acoustic wave — from location of the source of the wave down to the rock interface, and back upward to the location of the receiver — on the vertical axis, measured in milliseconds. The horizontal axis shows the location of the series of receivers along the survey line.
Two categories of reflection seismic survey have been completed.
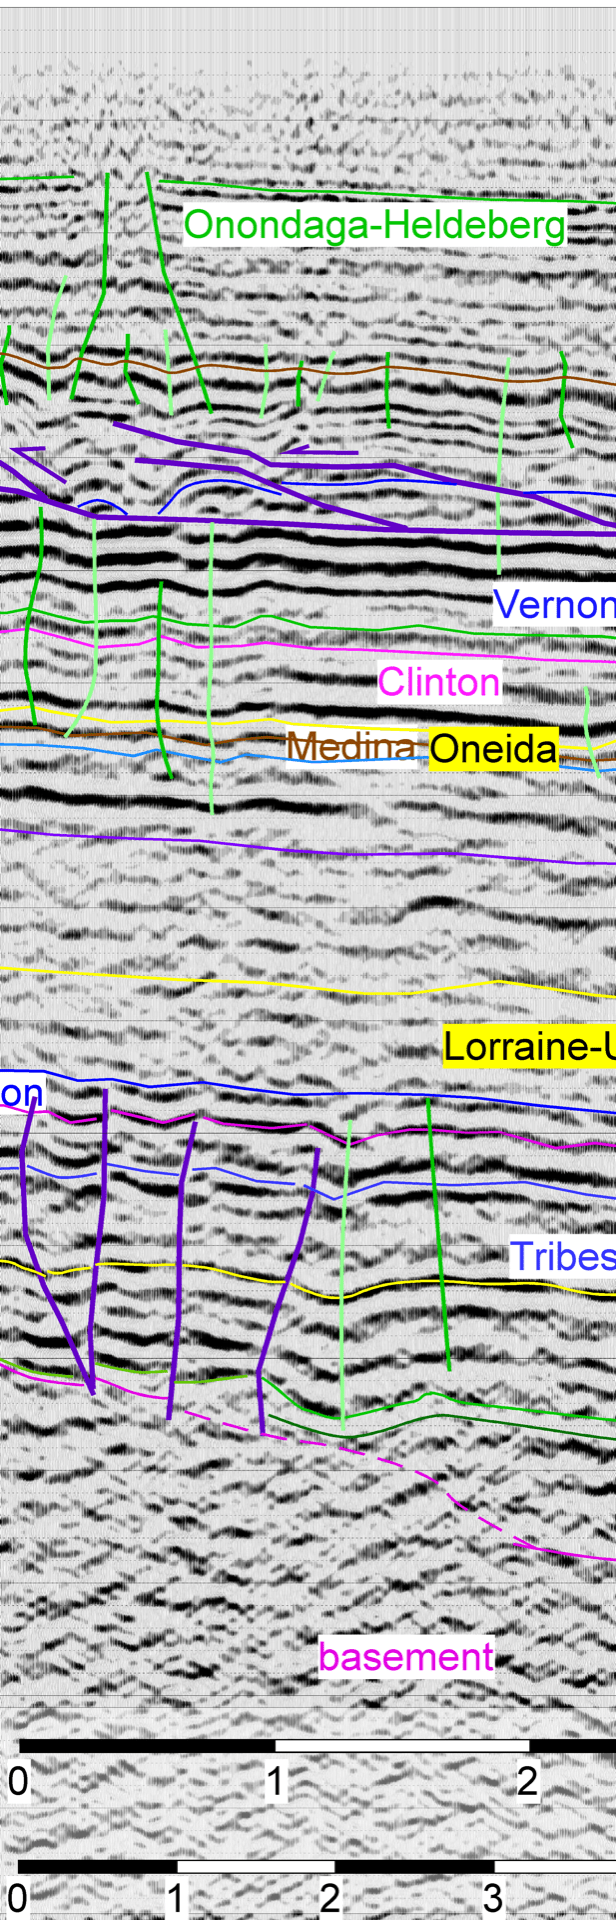
In the first category of reflection seismic study, Cornell leased from Seismic Exchange, Inc. the right to use about 150 km of two-dimensional seismic reflection data acquired decades ago by the natural gas exploration industry. With these good quality data (an example is shown above), a framework was established of knowledge of subsurface structures in much of Tompkins County. None of the available industry seismic data cross Cornell properties, yet the data illuminate the categories of folds and faults that occur nearby.
The results of this analysis are reported by Jordan (2019) at https://ecommons.cornell.edu/handle/1813/69546.
While most of the results of this broad-scale subsurface mapping were anticipated based on previous regional studies, at least two novelties arose that are of interest for their basic contributions to knowledge of central New York’s geological history. One unexpected result is new realization that sub-horizontal faults in the rocks exist at depths below the Silurian salt-bearing horizons. These are somewhat akin to ones well known a hundred kilometers farther south, in Pennsylvania, and they are interpreted to be the product of Late Paleozoic tectonic activity (Jordan et al., 2020). A second type of new insight concerns the apparent distribution of the Potsdam Formation, the basal Paleozoic sedimentary unit. A tentative interpretation of the contact between non-reflective basement rocks and the sedimentary rocks is that there existed a set of deep valleys eroded into the top of the crystalline basement, filled during the Cambrian by the basal sediments of the Potsdam.
The second category of reflection seismic study was developed to determine whether the subsurface beneath the eastern sector of Cornell’s campus is similar to the nearby area. To do so, an active seismic reflection survey was completed in 2018, using a vibroseis energy source. Several Cornell University geoscientists, assisted by student volunteers, deployed nearly 400 receivers (nodes) in the far eastern portion of Cornell’s campus. Nodes were programmed with GPS locations and then buried in shallow holes.
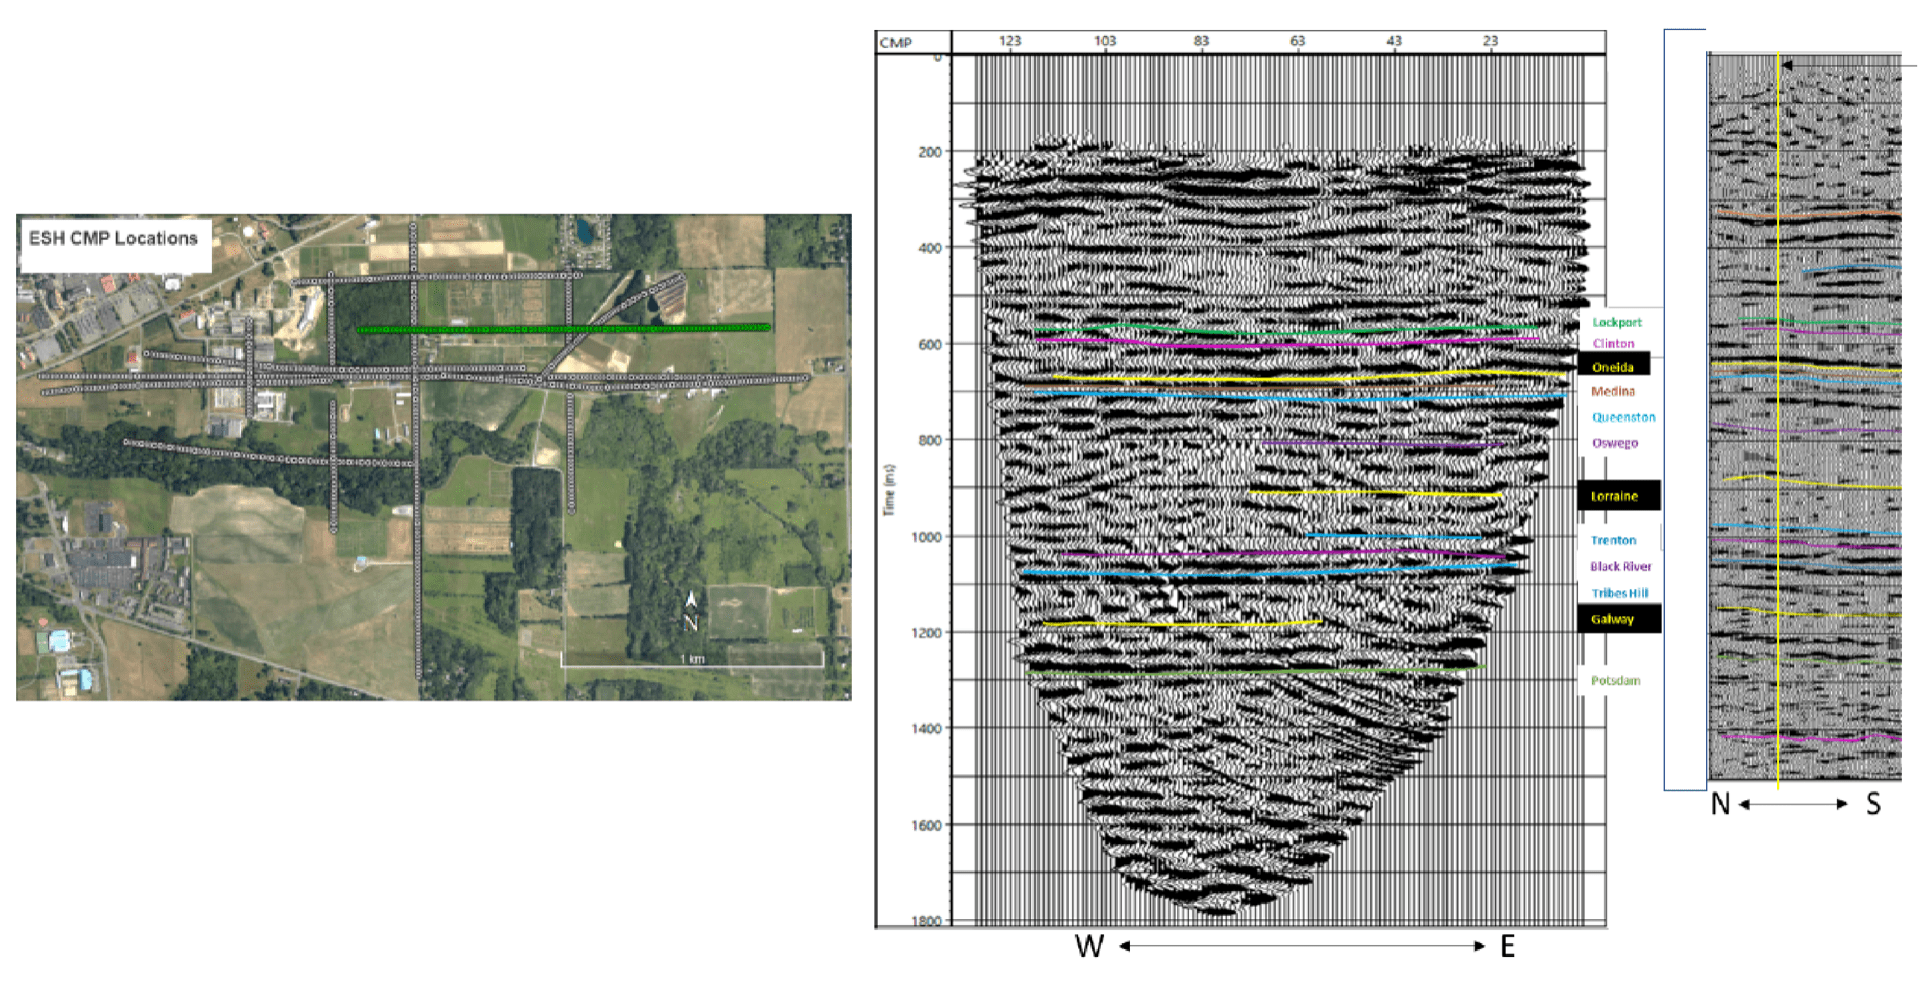
The Left image above shows a map of the locations of nodes (seismic energy receivers; gray dots) and the profile (green line) below which reflections were imaged. The Middle image shows one of the newly collected seismic profiles (green line of left image). These are processed data for the survey Line 1 / 5 (parallel to Stevenson Road) after migration and FX deconvolution. The Right image shows one of the industry seismic sections for comparison. The boundaries between two layers of rock are indicated by the dark lines seen running across the profile, for example at 1,080 milliseconds, a fairly flat and continuous layer can be seen. The orientation of and breaks in these lines allow for areas of rock deformation to be identified, helping engineers and scientists determine the best location for geothermal wells. Furthermore, the development of an accurate velocity model for the subsurface allows for the two-way travel times to be converted to depths, a more useful measurement when it comes to determining where these structures actually are. The colored lines indicate the interpretation of approximate positions of sedimentary rock formation contacts.
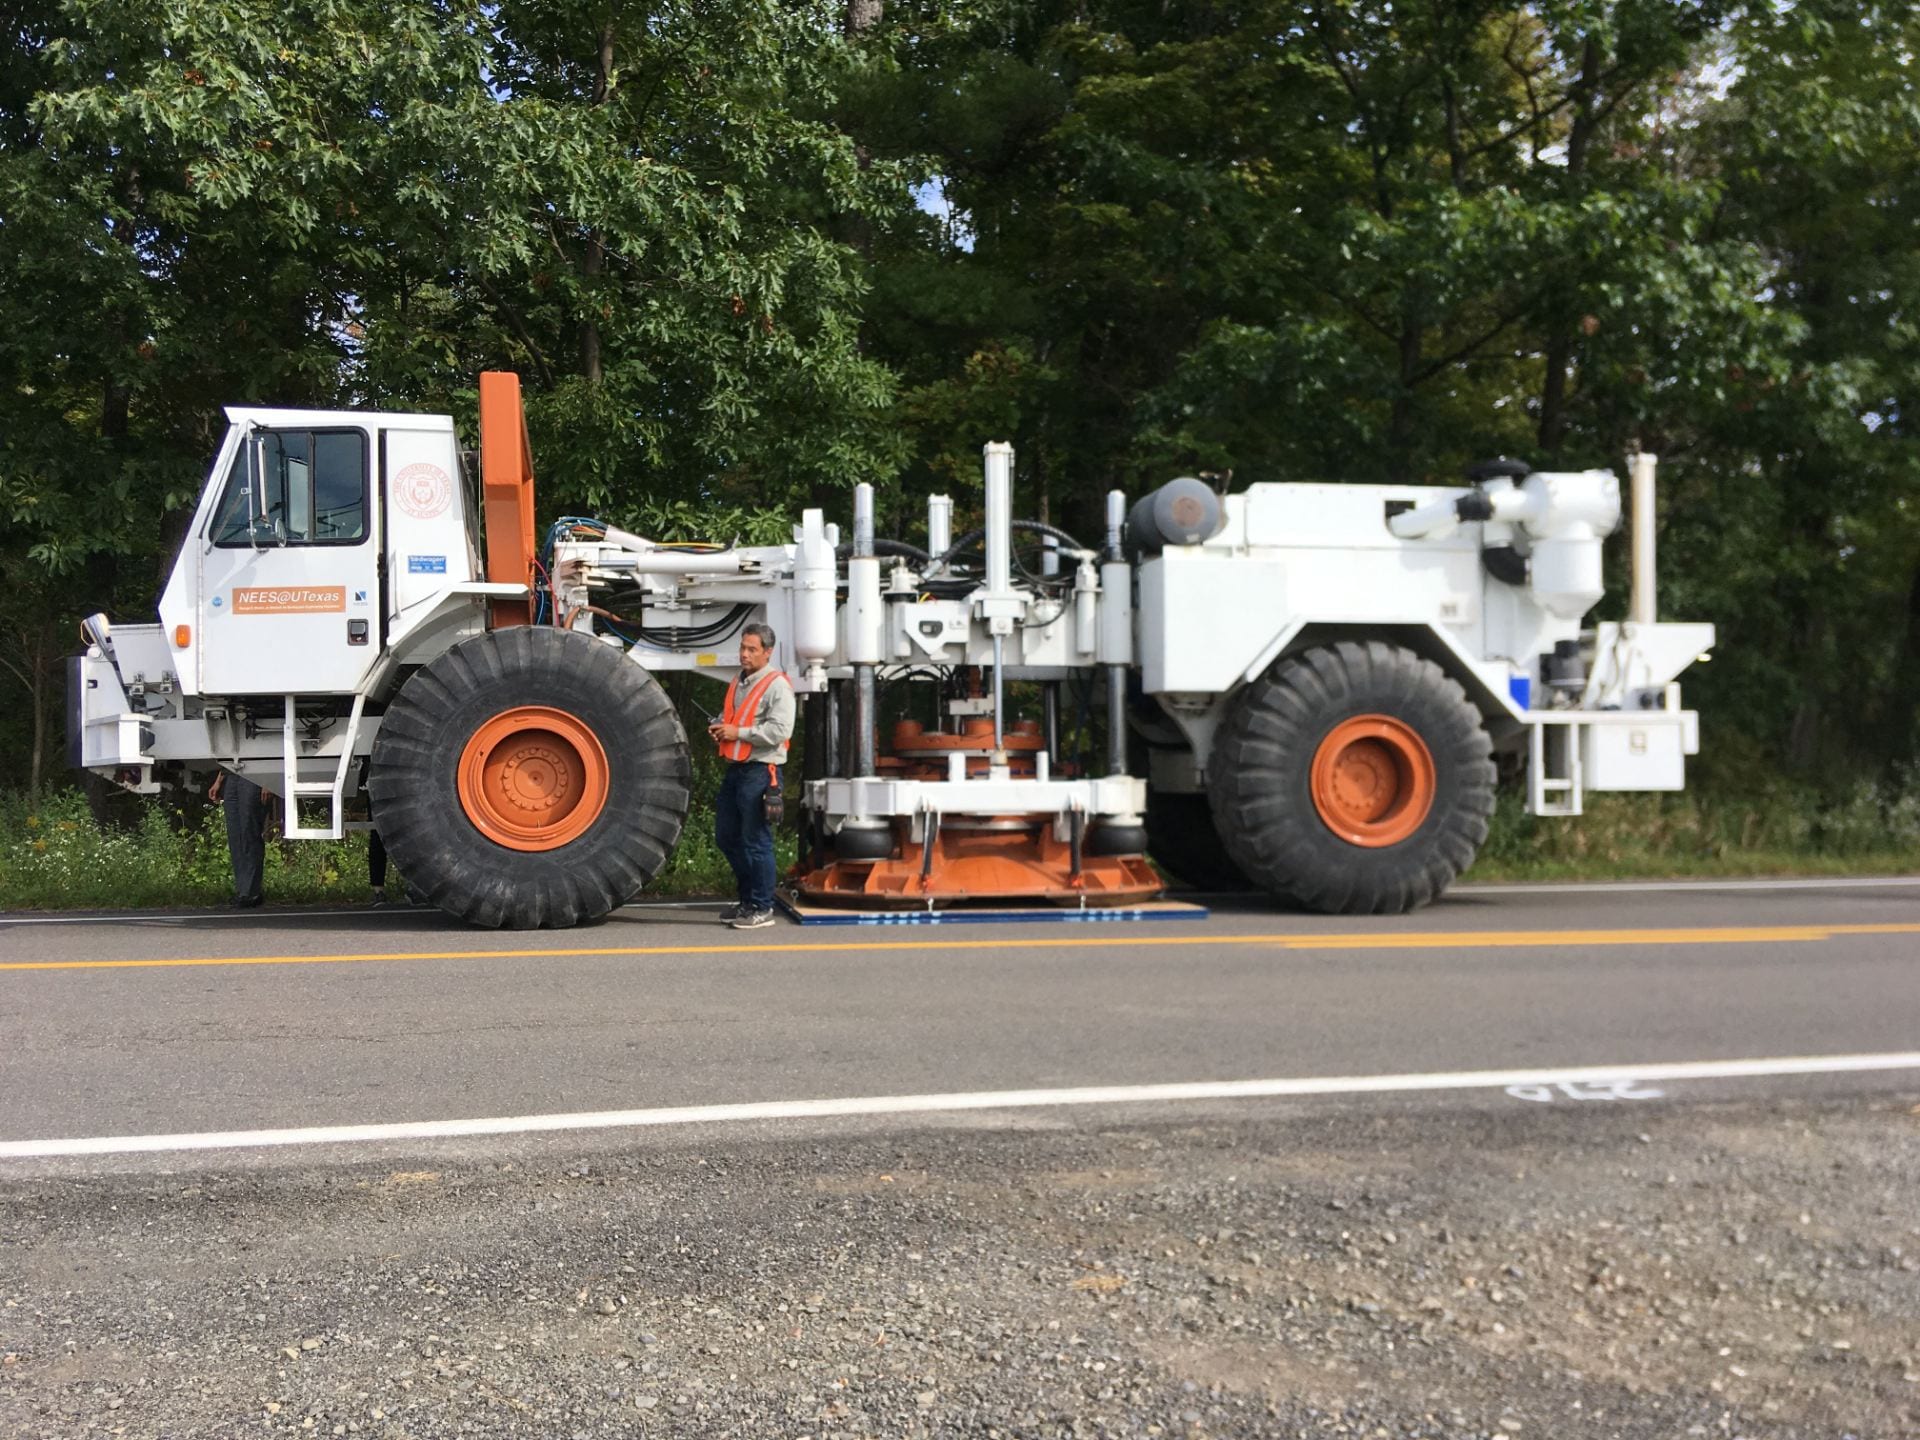
The active survey was carried out over a period of one week. A vibroseis truck called T-Rex, capable of generating sound waves from 5 – 80 Hz, was used as the source. The truck was operated by scientists from Network for Earthquake Engineering Simulation (NEES) at UT Austin, a national network of large-scale labs that assist with studying the effects of earthquakes and tsunamis on buildings and bridges. The T-Rex ran several vibration “sweeps” along the survey lines, which were recorded by the 400 nodes in place.
The nodes were left in place for two weeks following the active experiment to passively record any background seismicity in the region.
The results of this analysis are reported by May et al. (2019) at https://ecommons.cornell.edu/handle/1813/69547.
Natural Seismicity Arrays
Passive seismic signals are especially valuable because they reveal locations where rocks are shifting or straining prior to any activities related to ESH. They will be vital to monitoring the mechanical changes to the subsurface that accompany work undertaken in the future to set up an effective transfer of fluids and heat from and through a geothermal reservoir.
A network of passive seismic recorders was deployed during 2015. The results of that experiment are two-fold. First, it helps us to appreciate the ambient level of seismic activity near Cornell and elsewhere in Tompkins County. Second, the detection of zones of modest seismic activity outside of that initial network was vital information needed for the design of a broader array of instruments, which were installed in 2019 and will remain in place for a longer time. An analysis of the 2015 array data is reported by McLeod et al. (2020) at https://hdl.handle.net/1813/69609. An analysis of the array installed in 2019, CorNET21, by Suhey et al. (2021) is available at https://ecommons.cornell.edu/handle/1813/103518.