Rocks suitable for slow passage of fluids through pore spaces that separate solid minerals are referred to as reservoirs. A potential geothermal energy project in the region of Cornell University begins without prior documentation of the depths at which there may be potential reservoirs. To attempt to fill this knowledge gap, three general approaches are possible. First, we can use existing data sets for relatively nearby boreholes to estimate which geological units are likely to have favorable and unfavorable properties, and to gain an understanding of the range of porosity values that plausibly exist. Second, we can use “outcrop analogues”, meaning that we look in areas where the rocks expected below Cornell crop out at the surface, and learn the properties of the rocks at those locations. Third, we can design and deploy geophysical tests that may be able to detect the distribution of mobile fluids in the rocks.
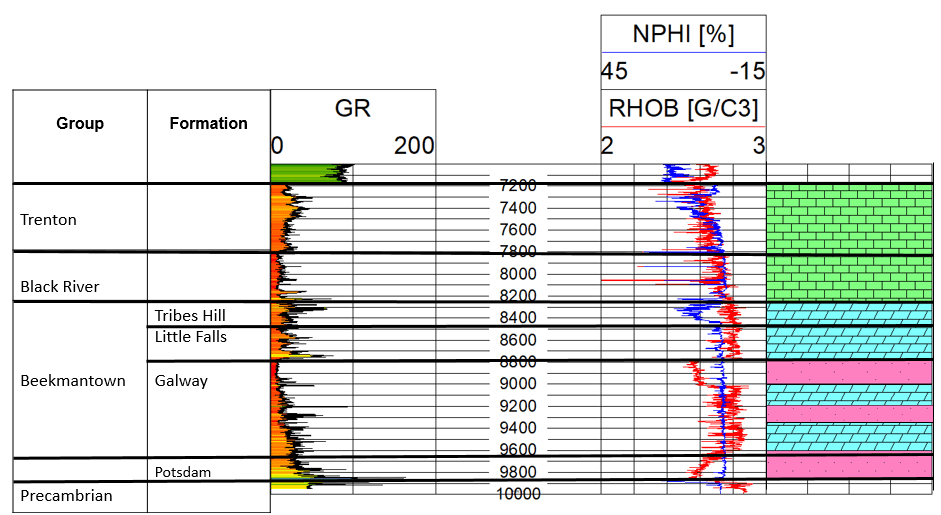
Tops of groups and formations are picked (bold black lines), and well logs (Gamma Ray, Neutron Porosity Hydrogen Index, and Density logs) are analyzed for petrophysical qualities. This example is a section from 7,000′ – 10,000′ measured depths of a well in Steuben county.
The Cornell group is using geologic and thermodynamic property values of three primary reservoir targets to estimate the thermal energy that may be produced from each reservoir. To date, simple reservoir models for fluid flow and heat extraction from two of the geological reservoirs have been evaluated. These are presented in the dissertation study by Jared Smith (2019).
Geologic data used to define parameter values for reservoir modeling include temperature measurements from local wells, Empire State Oil and Gas Information System well logs, sparse porosity and permeability data for physical samples from deep boreholes in central and western New York, and fracture orientation and spacing analysis for the Adirondack Mountains in New York State.
The assembled information is used to estimate depth-to-reservoirs beneath Cornell’s campus and to interpret and estimate “true” effective porosity values, permeability values, and reservoir thicknesses. The TOUGH2 (Transport of Unsaturated Groundwater and Heat, version 2) suite of software is utilized to model geothermal fluid temperature, pressure and flow rate over time. In addition to the geological properties, these reservoir production simulations require information for subsurface pressure, temperature, and heat flow, all of which are constrained by existing data for the region, as well as for fracture properties, the temperature and flow rate of fluid re-injected after heat extraction, the distances between production and injection wells and well depths, and additional simulation parameters. The latter set of parameters are estimated, in order to test a range of scenarios.
Uncertainties are captured by varying critical parameters within anticipated ranges to see how they affect performance.
The three primary identified reservoirs are as follows:
- The carbonate rocks immediately below the Trenton-Black River (TBR) group contact at approximately 2.3 km depth below Cornell. At widely spaced locations in the region, the rock interval contains relatively high permeability in a hydrothermally altered dolomite. This reservoir category was the focus of work by Erin Camp, PhD ’17. The regional seismic reflection study did not illuminate near Cornell the type of small graben in which TBR-suitable dolomite bodies usually occur, making this category of reservoir unlikely.
- An interval of dolomite and sandstone between the Black River Formation and the top of crystalline basement, encompassing the Little Falls, Galway, and Potsdam formations, contains zones of elevated porosity where sampled in a set of boreholes not far from Ithaca. Below Cornell, these units are expect to span depths of approximately 2.4 – 2.9 km. This reservoir evaluation was the focus of research by Jood Al Aswad, M.S. ’19.
- Metamorphic basement rocks starting at 3000 m depth, for which little information about hydrogeologic and thermal properties are known in the Ithaca region. Hence we examine the distribution of fractures in the Adirondack Mountains, where similar rocks are accessible at Earth’s surface. The documentation of fracture properties is largely the work of Tasnuva Ming Khan (B.S. ’18), Jacob Paul (B.S. ’19), and Nicolás Rangel Jurado (currently an MS student).
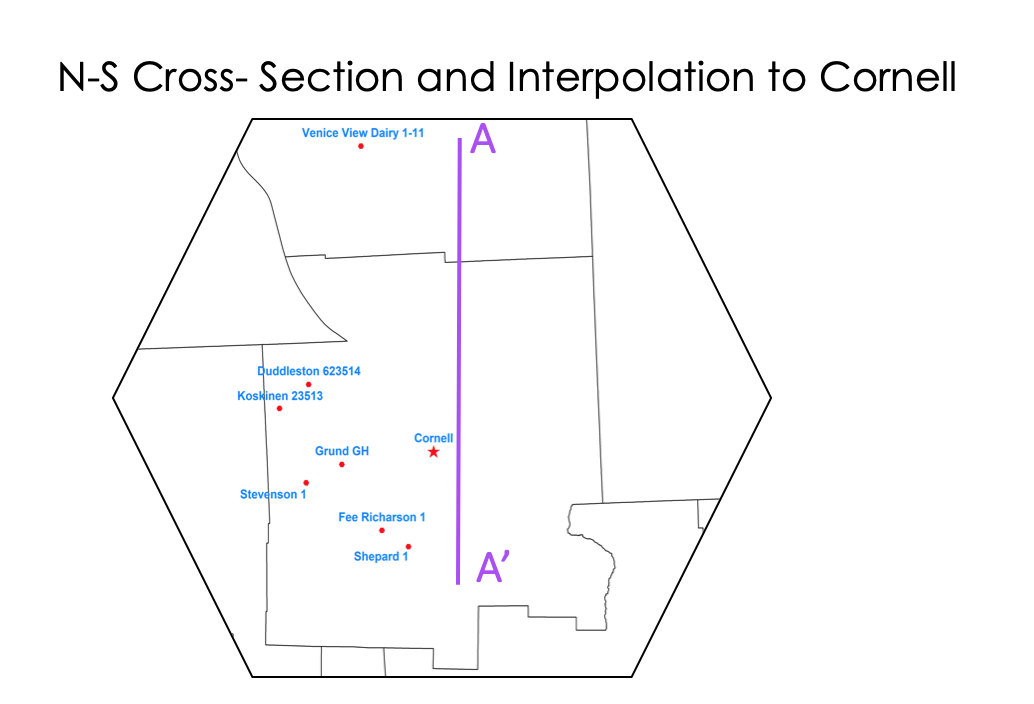
Map of the locations of exploration boreholes in the region surrounding Cornell, whose data were analyzed to generate the subsurface geological model shown in the cross section (below). The purple line marks the line onto which are extrapolated all of the borehole-based interpretations.
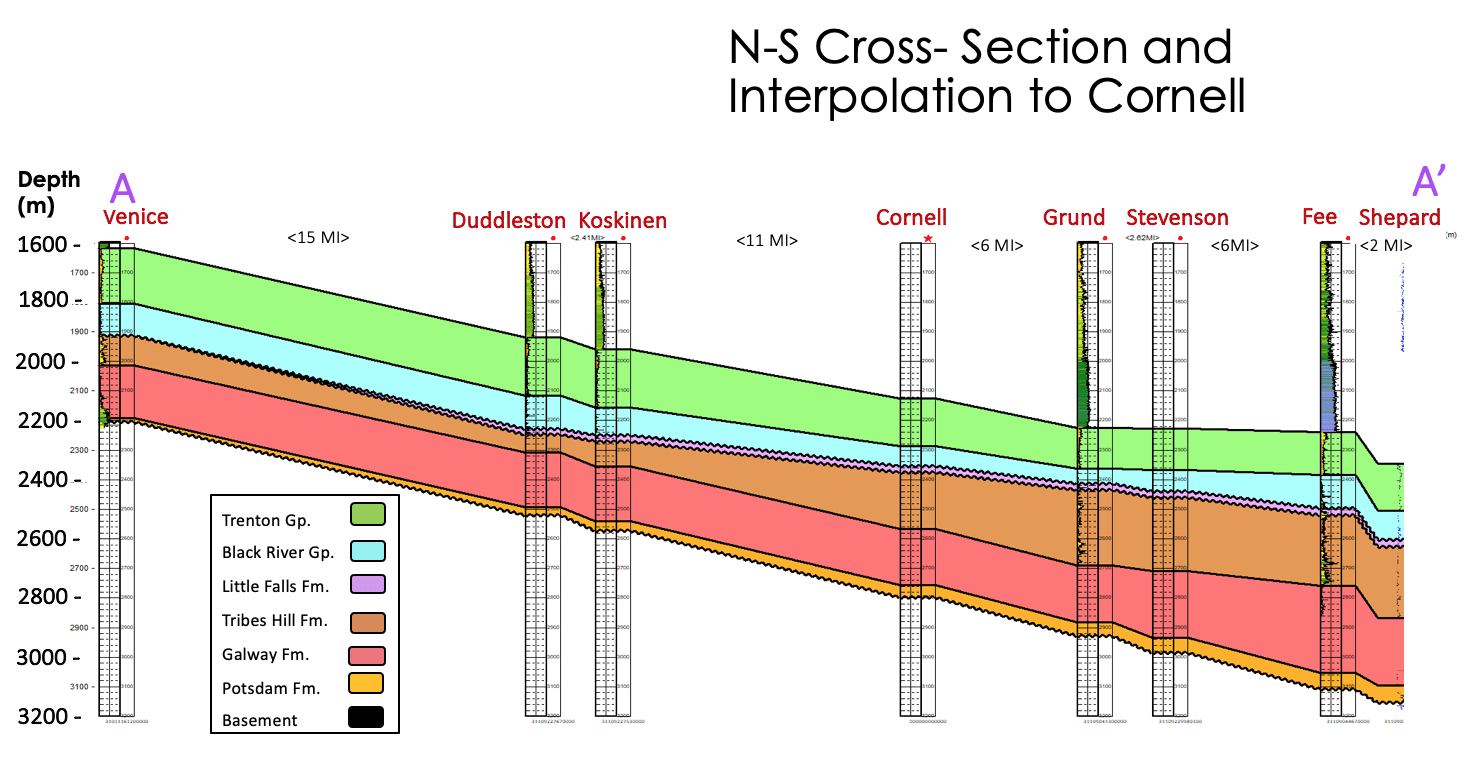
The geological units in the subsurface beneath Cornell can be estimated based on the positions of formations in exploration boreholes distributed in the region near Ithaca. Using well log data, the positions of formation boundaries and of the contact separating the sedimentary rocks (above) from the crystalline basement (below) were identified in 8 boreholes. That set of information is extrapolated to a single north-south line that passes through Cornell. A vertical slice along the north-south line is presented here as a cross section of the geological units, and displays the position of Cornell relative to the extrapolated geology. From Al Aswad (2019).
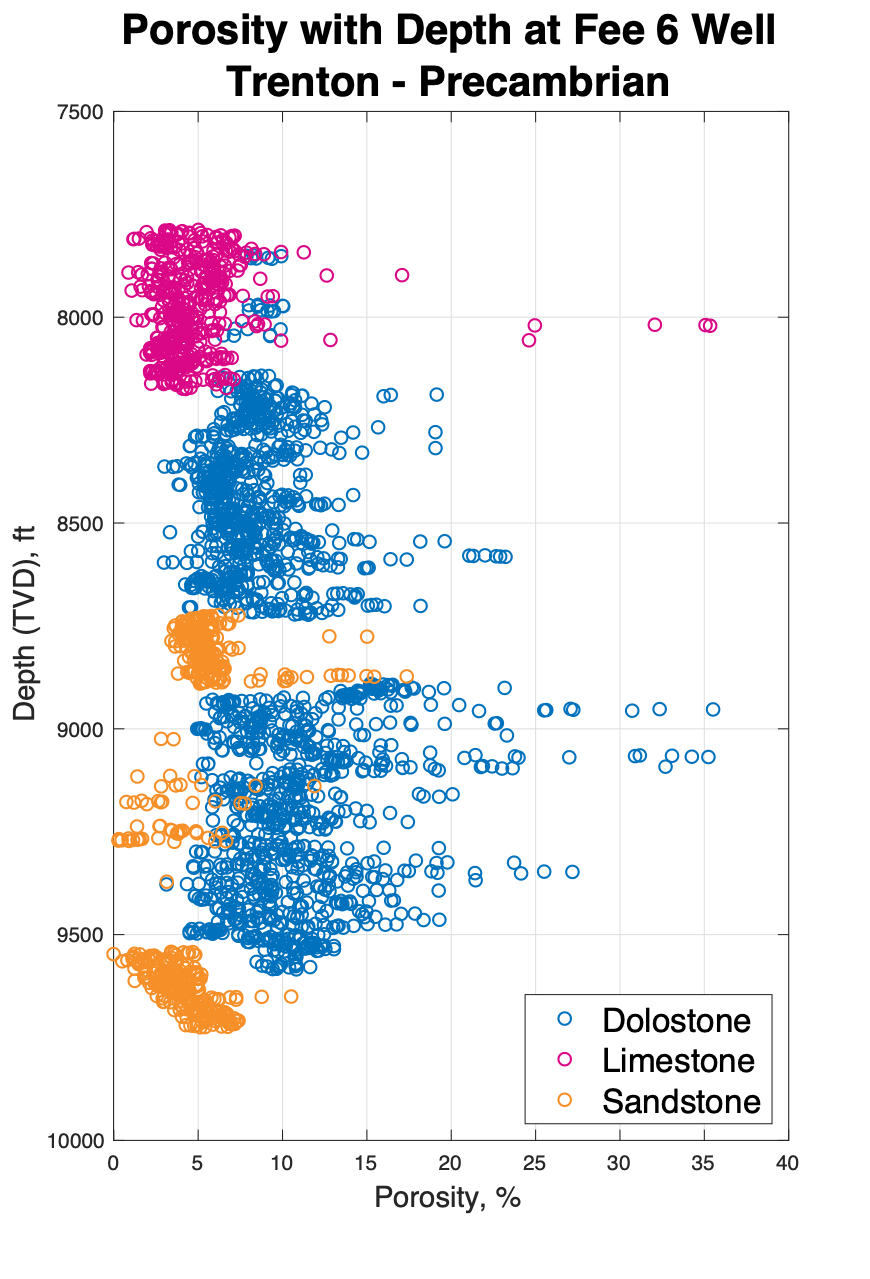
The New York State database for well logs contains data of value for determining the porosity of subsurface rock units, but those data must be corrected to reduce the impact of unwanted signals. This example from a borehole in Steuben County illustrates the estimated porosity after corrections for the interval of rocks between the Black River Formation and the crystalline basement. The colors of the data reveal that rocks whose mineralogy is dominated by dolomite display higher values of porosity than do most limestones and sandstones. From Al Aswad (2019)
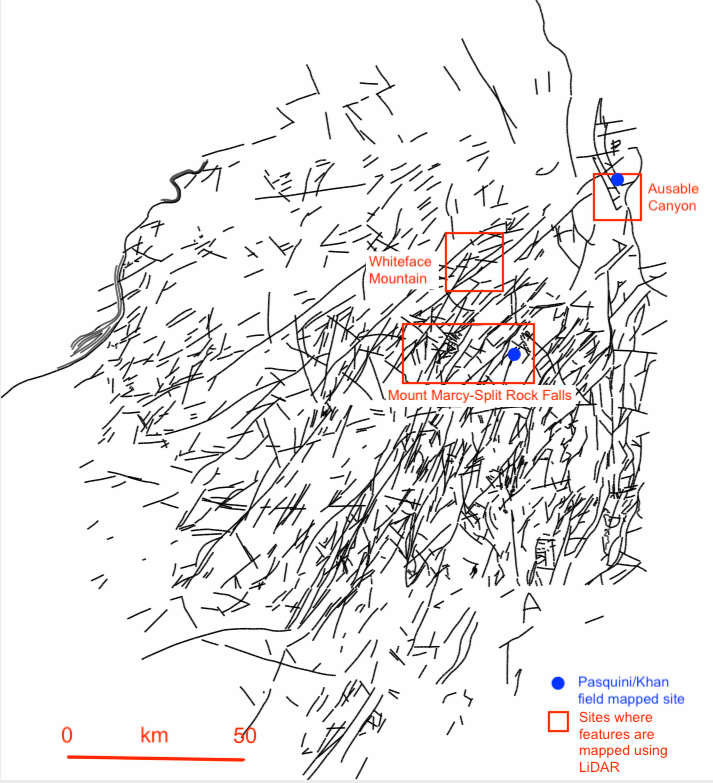
The “outcrop analogue” approach to gain an understanding of potential reservoirs in the crystalline basement rocks below Cornell is needed because we lack direct subsurface data. Fortunately, the Adirondack Mountains expose at the surface metamorphic rocks that are expected to be similar to those in the Ithaca region below a depth of about 2.9 km. Geologists have constructed maps, like this one available from the New York state data archives, of the distribution of fractures in the Adirondacks. We are interested in the spatial distribution of fractures at a smaller spatial scale. Hence for the areas in the boxes, we constructed more detailed fractures maps based on the variable weathering and erodability of zones of fractures. Nature has exploited the variations in weathering and erosion properties of the rocks to create topographic patterns. To find the topographic features related to fractures, we used high spatial resolution images of elevation that were produced from publicly available LiDAR data.
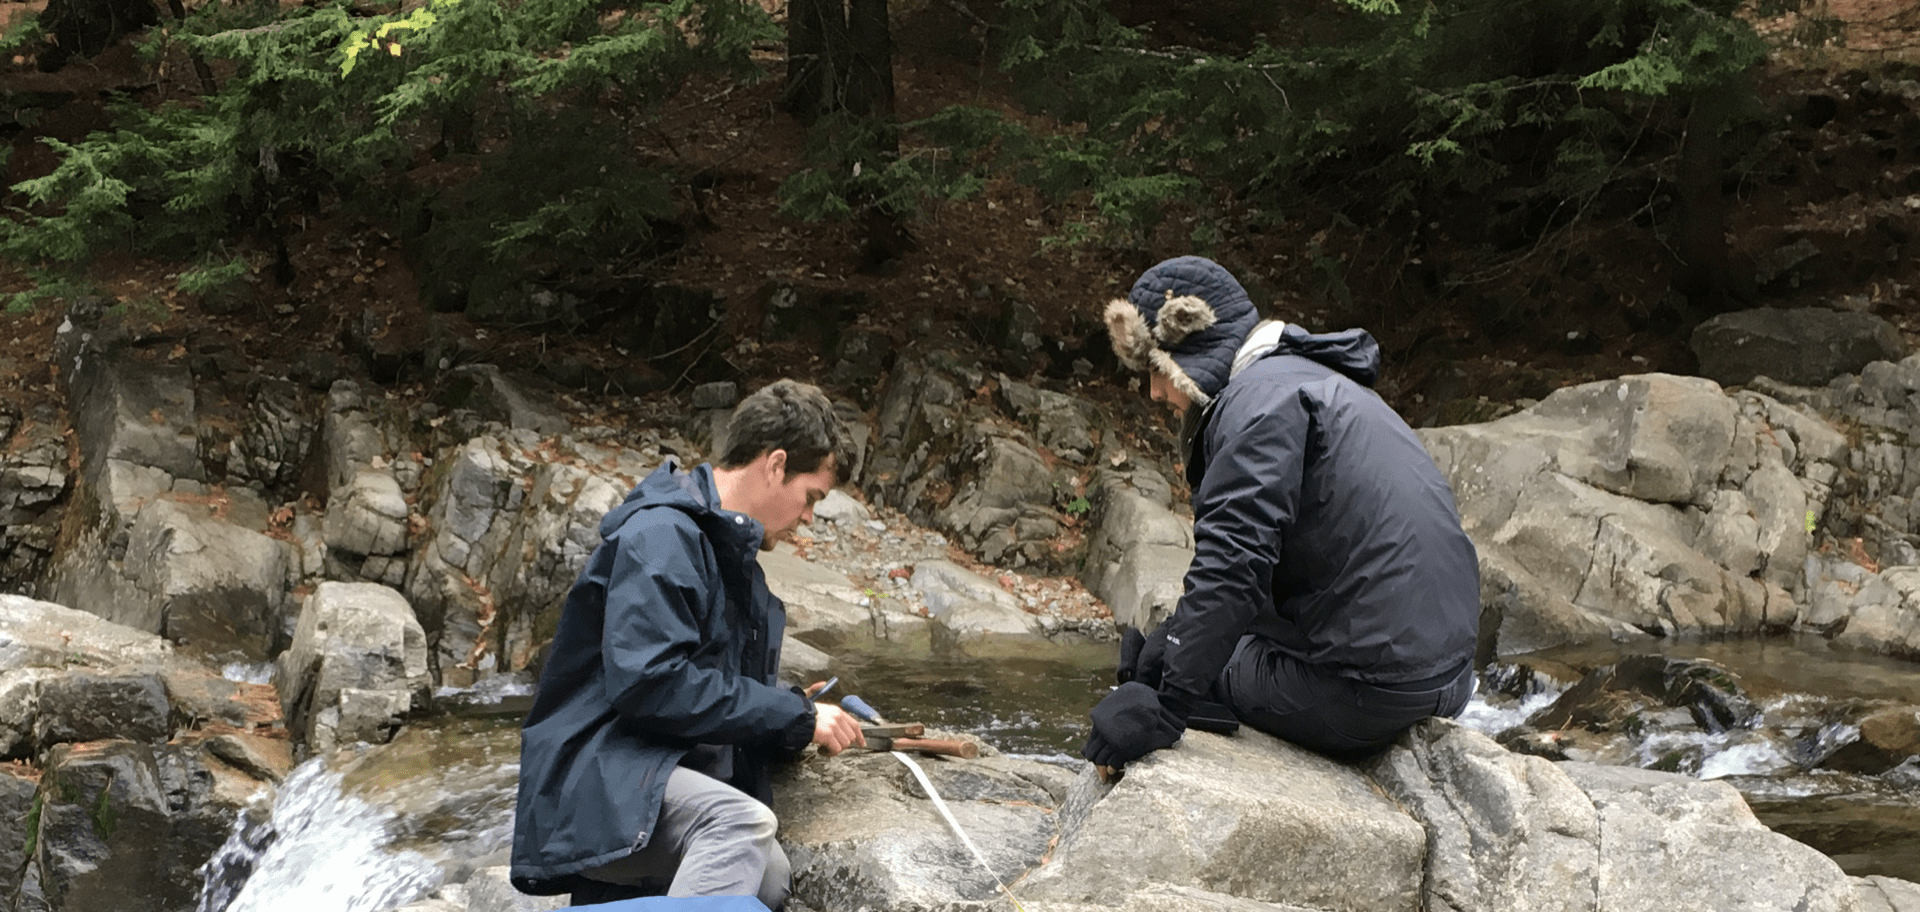
The next step downward in spatial scale, to fracture sets that occur at length scales of centimeters to a few meters, can best be accomplished through examination in-the-field of the rocks. We have three field data sets for comparison to the LiDAR-based fracture data sets. In the photo, Jacob Paul and Nicolás Rangel Jurado document the distance between fractures of various orientations at Split Rock Falls.