The existing national and regional networks of seismometers are not sensitive enough to detect seismic activity in Tompkins County – notice the lack of any earthquakes on the U.S. Geological Survey map of earthquakes spanning 1914-2023 in Tompkins County. In order to detect small earthquakes, earth scientists at Cornell University established a local network of seismometers.
In 2015-16, a first network of 12 seismometers, called CorNET16 (Cornell Network 2016) was installed across a 5-mile-wide zone, using seismometers loaned by a national program. This network provided valuable data about the background seismicity, and also about the challenges of finding correct earthquake locations and determining the strength of the very small earthquakes. At the conclusion of the CorNET16 study, it was decided that another network of seismometers covering a larger area and for a longer period of time would be beneficial.
CorNET21 was installed in July 2019 and is expected to be in operation at least through 2023. CorNET21’s data are collected and analyzed through a contract with an independent company, Weston Geophysical Group. This array of 17 stations covers a bigger footprint – about three times as broad an area. To reduce the noise registered on the seismic records, some of the CorNET21seismometers are buried 2 feet (or 0.5 meters) below ground surface, and several are installed 30 feet (or 10 meters) below the ground surface. During 2019, the network recorded a very large amount of “seismic activity” caused by construction projects, along with some earthquakes located far away from Tompkins County and some small earthquakes within the boundaries of the seismic network.
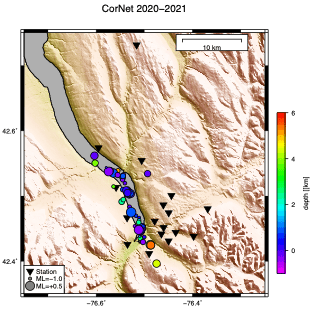
In years 2020 and 2021 there was much less construction within the area of the seismometer network, which simplified analysis of the seismic waves. The map shows the “catalog” of all earthquakes (circles) that occurred within the boundaries of the seismic network during those two years (locations of the seismometers are marked by black triangles). The size of the circle marks the magnitude of each earthquake. The color marks the depth below the surface to the hypocenter (the colored depth scale is measured relative to sea level, in units of kilometers).
Almost all the earthquakes occurred along the axis of the Cayuga valley: under Cayuga Lake; south of the lake under the City of Ithaca; under South Hill. Just one occurs east of the valley, in Lansing. All of earthquakes had magnitudes less than 0.6 ML. The locations where a slipping rock generated a seismic wave were short distances (less than 4 miles) below the ground surface.

CorNET data is being continually analyzed by Weston Geophysical, an external, independent consulting firm based in Burlington, Massachusetts that is focused on seismic monitoring and geophysical research. Each week during summer 2022 while the CUBO well was being drilled and tested, they supplied the CUBO science and engineering team with a report on recent seismic events. Had there been any events near the well site, the information would have been used in operational decision-making at the site. Those reports will be posted here.
Digging deeper: More about seismology and earthquakes
Earthquakes: What? Where? How are they measured?
Earthquakes Caused by People
Earthquakes in New York State
